Based on previous posts the code is
extended with couple of new features.
First the parallel link algorithm is
enhanced using http://webiks.com/d3-js-force-layout-straight-parallel-links/ calculation, please see the link for more details. I have
parallel links support and 'half links' to support displaying in/out link
utilisation.
Same as before I'm using py ez to parse the
isis database from a juniper device. This creates a json with all the links in
the topology. The json also contains information about current 5 minutes
utilisation and snmp ifindex for each link.
The weathermap function is based on snmp
data collected by telegraf and stored in influxdb. The py ez script will
populate the json with information from influxdb. Basically for each link we
have the IP address, based on this we query influxdb to get the snmp ifindex.
Then I do a second query to get the last 5 minutes util and the link capacity.
The resulting json has the following
information:
Source, target, local ip, remote ip, util,
capacity, local_ip_remote_ip, ifindex.
[{"r_ip": "x.x.x.x",
"l_int": 49, "capacity": 10000, "target":
"PE1-CPT", "metric": "145",
"l_ip_r_ip": ["x.x.x.x", "y.y.y.y"],
"util": 1491081683, "source": "PE1-GSW",
"r_int": 0, "l_ip": "y.y.y.y"}
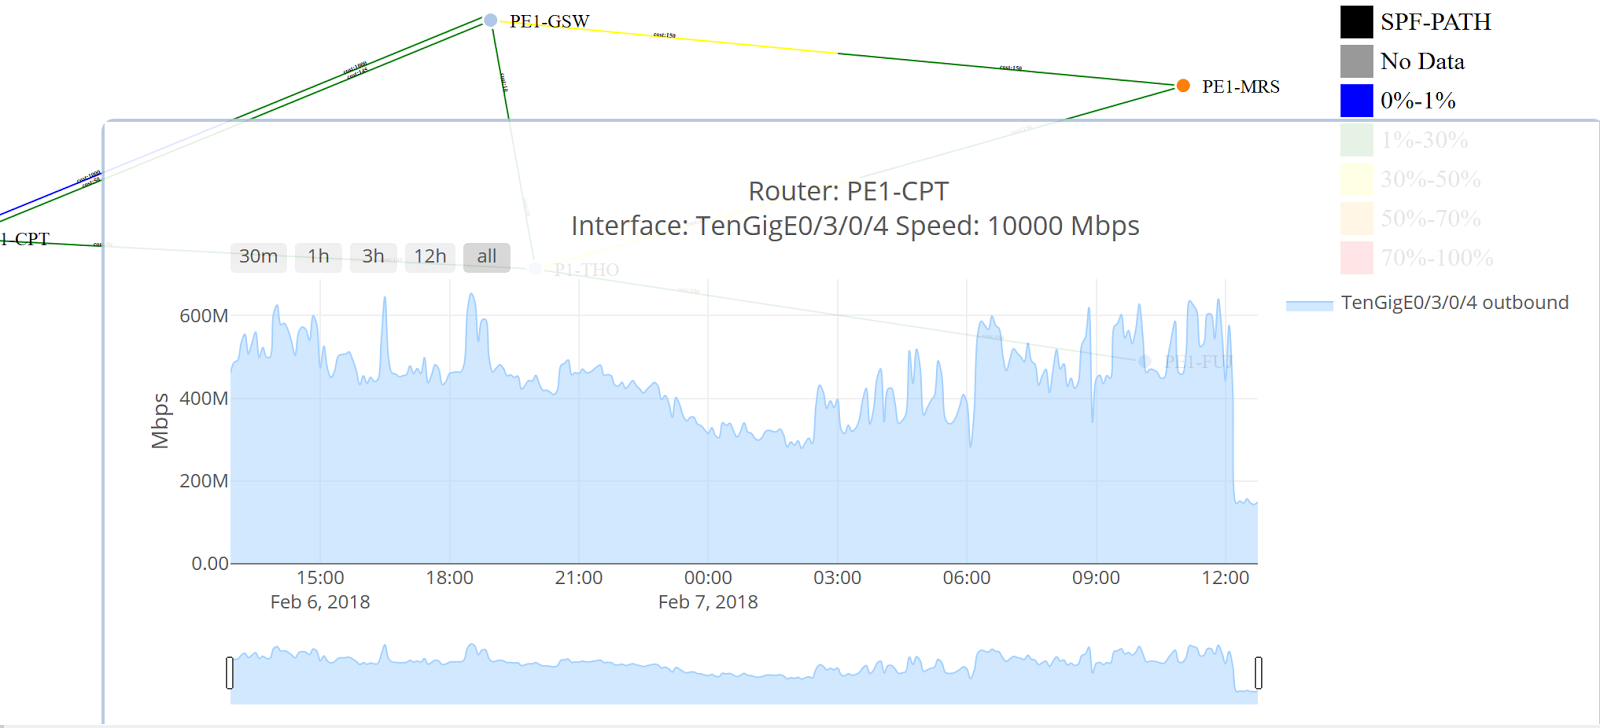
After the d3js topology is displayed,
clicking on an link will create a plotly graph with last 24h utilisation. This
is done via ajax query to the api. The request argument is host + ifindex. The
api will query influxdb and get the snmp information.
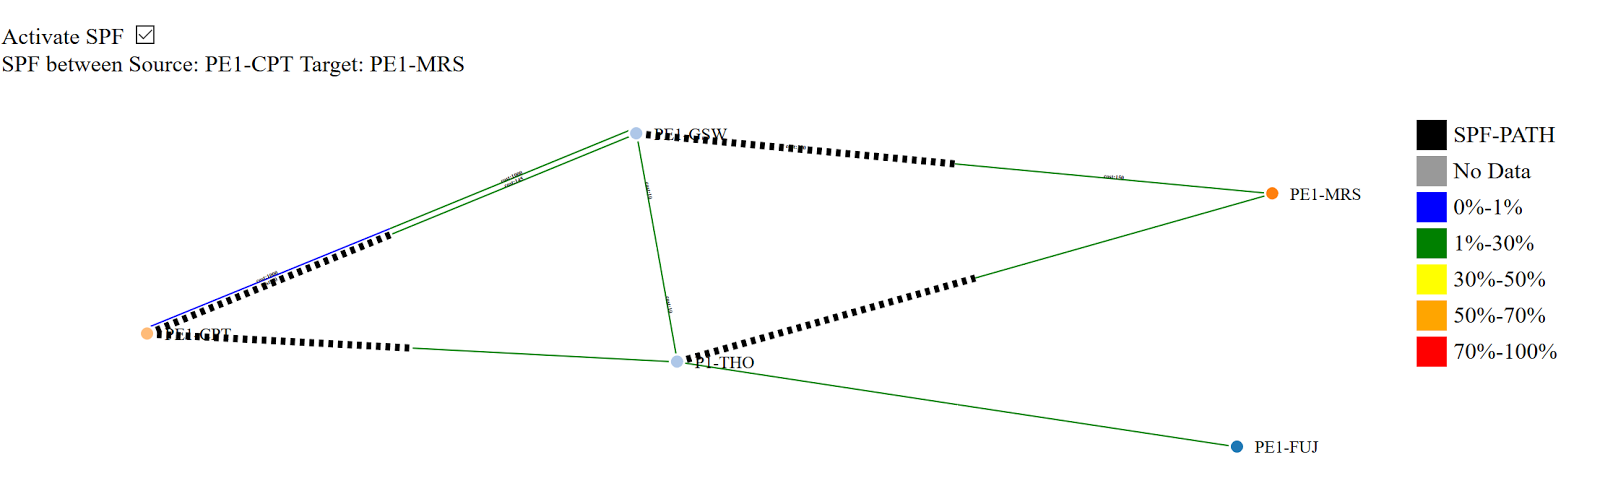
The last piece of the puzzle is the
dijkstra algorithm to find shortest path between nodes.
This is achieved using networkx python
library and works on top of flask. The js code sends a request with all links
array, source and destination. The api will return all links id for all ecmp
paths between nodes. Based on link Id d3js will colour the links with dotted
lines.
Demo time:
Topology:
Plotly graph on link click:
Dijkstra's spf between two nodes:
Code on https://github.com/cpmarvin/lnetd
Leave a message if you have a hard time
replicating this. This project started as a learning exercise and the code is
not very clean.